The Beginners Guide to Mastering Candlestick Charting for Profitable Trades
At Chart the Trade, we empower traders to master a wide range of charting techniques—candlestick, bar, line charts, point and figure, Renko, Heikin Ashi, and more—to make informed trading decisions. Candlestick charting, one of the most common and versatile retail methods, reveals market psychology through price action, helping traders spot high-probability setups. This guide dives deep into the art and science of candlestick charting, covering essential patterns, advanced strategies, and practical tips to enhance your trading. Whether you’re analyzing forex, stocks, or crypto, mastering candlesticks will sharpen your charting skills and boost your profitability.
Understanding Candlestick Charts
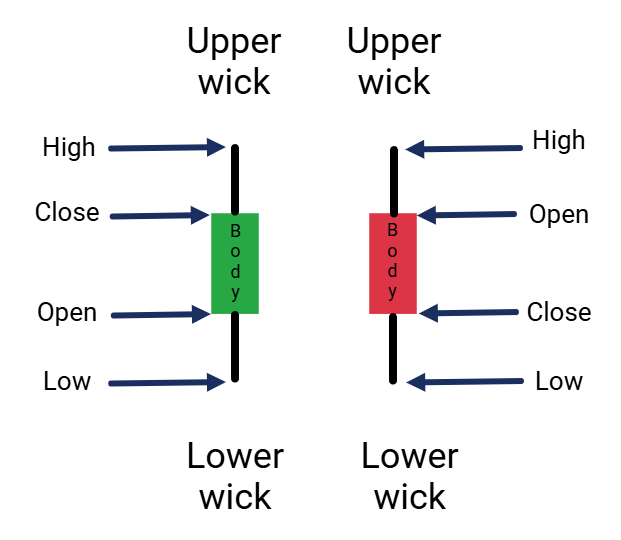
Candlestick charts, developed in Japan centuries ago, remain a cornerstone of technical analysis across all charting disciplines. Each candlestick captures price movement over a chosen timeframe (e.g., 1 hour, 1 day), displaying four key points:
- Open: Price at the start of the period.
- Close: Price at the end of the period.
- High: Highest price reached.
- Low: Lowest price reached.
The body (rectangle between open and close) shows the price range, while wicks (lines above/below) indicate highs and lows. Bullish candles (close > open) are often green or white, and bearish candles (close < open) are red or black. Patterns formed by these candles reveal market sentiment, making candlesticks a universal tool alongside other charting styles like Renko or point and figure.
Why Candlestick Charting Matters
Candlesticks stand out for their ability to reflect trader psychology—fear, greed, indecision—that drives price action across markets. Key benefits include:
- Predict Reversals: Patterns like Doji signal potential trend changes.
- Confirm Trends: Bullish patterns validate uptrends, bearish ones downtrends.
- Enhance Precision: Pair with other charting tools (e.g., support levels, indicators) for better trades.
- Versatility: Applicable to any market or timeframe, complementing ChartTheTrade.com’s coverage of Renko, Heikin Ashi, and more.
This guide will teach you how to harness candlesticks to chart smarter and trade better, no matter your preferred charting style.
6 Essential Candlestick Patterns to Master
Below are six timeless candlestick patterns critical for traders. Each includes its formation, meaning, and trading approach, ensuring you can apply them universally.
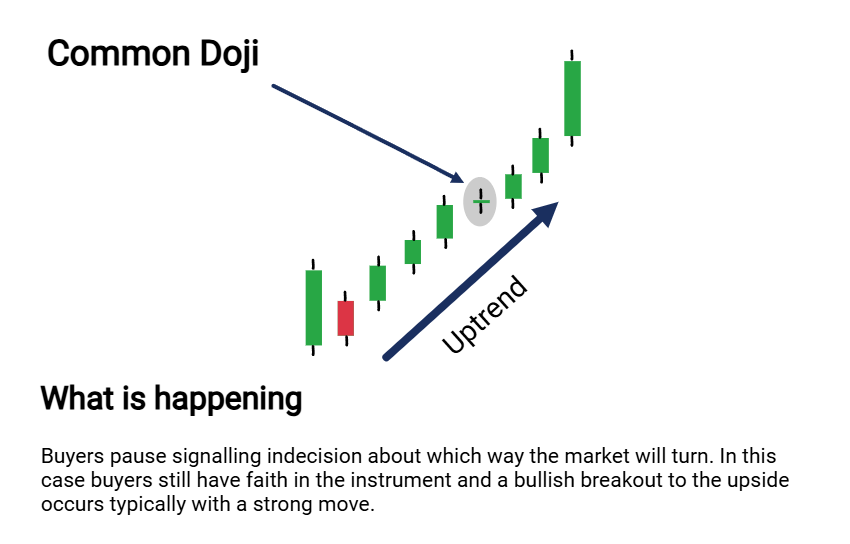
1. Doji
- Formation: Open and close are nearly identical, creating a small body with long wicks.
- Meaning: Market indecision, often preceding a reversal.
- How to Trade:
- Look for a Doji after a prolonged trend (uptrend for bearish reversal, downtrend for bullish).
- Confirm with a support/resistance level or indicator (e.g., overbought RSI).
- Example: A Doji in an uptrend. Market pauses signalling indecision represented by the Doji. Still value to be had and more buyers enter the market.
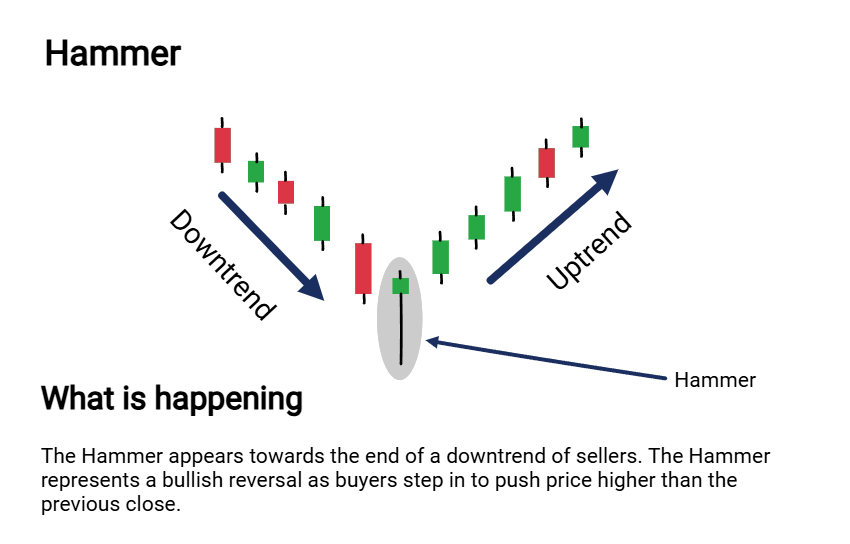
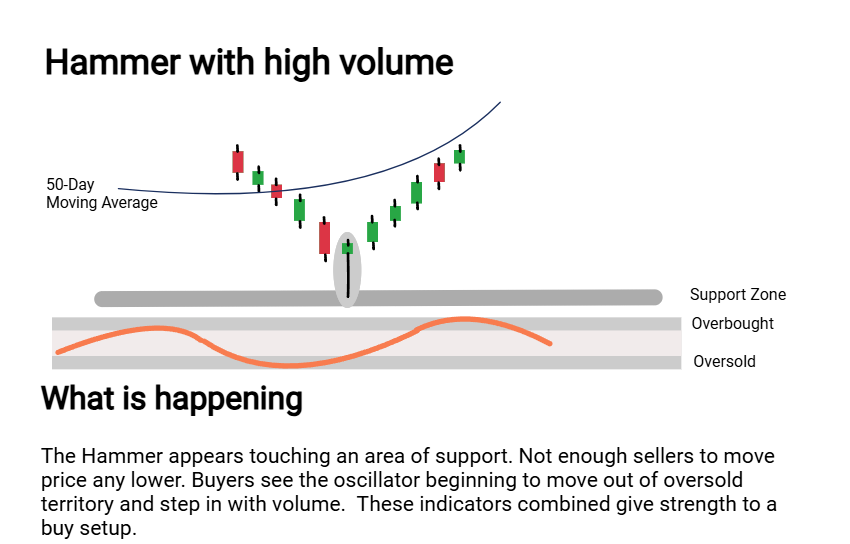
2. Hammer
- Formation: Small bullish body at the top, long lower wick (2–3x body), minimal upper wick.
- Meaning: Bullish reversal after a downtrend, showing buyers defending a level.
- How to Trade:
- Confirm with a bullish follow-up candle or support level.
- Buy above the Hammer’s high, stop below its low.
- Example: A Hammer at a trendline indicates a potential rally.
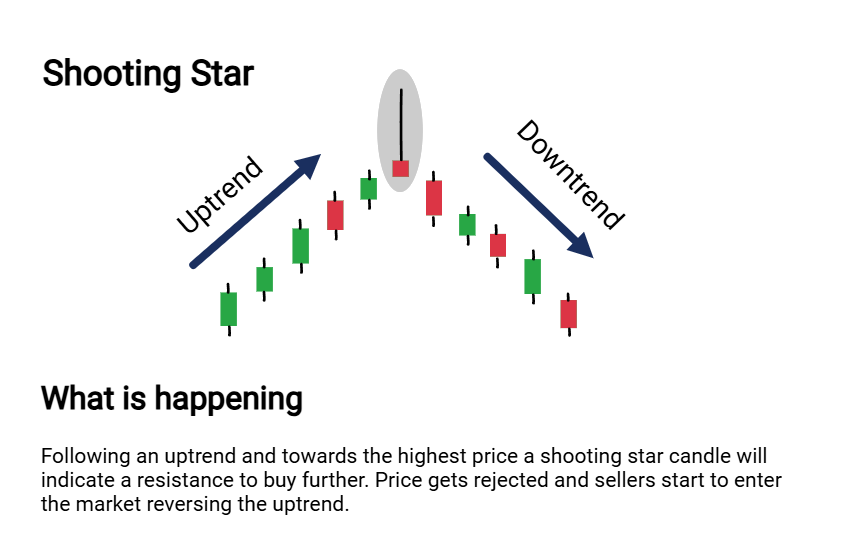
3. Shooting Star
- Formation: Small bearish body at the bottom, long upper wick (2–3x body), minimal lower wick.
- Meaning: Bearish reversal after an uptrend, showing seller rejection.
- How to Trade:
- Wait for a bearish candle to confirm.
- Sell below the Shooting Star’s low, stop above its high.
- Example: A Shooting Star at a key resistance warns of a decline.
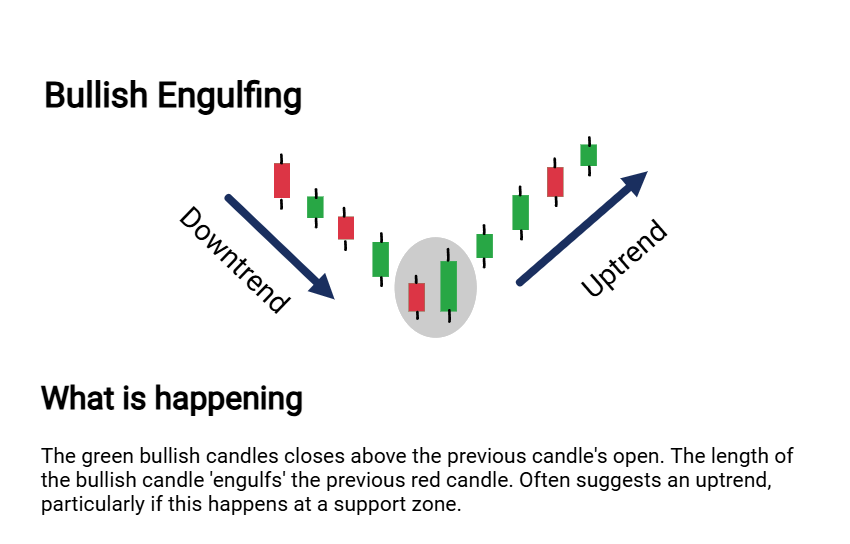
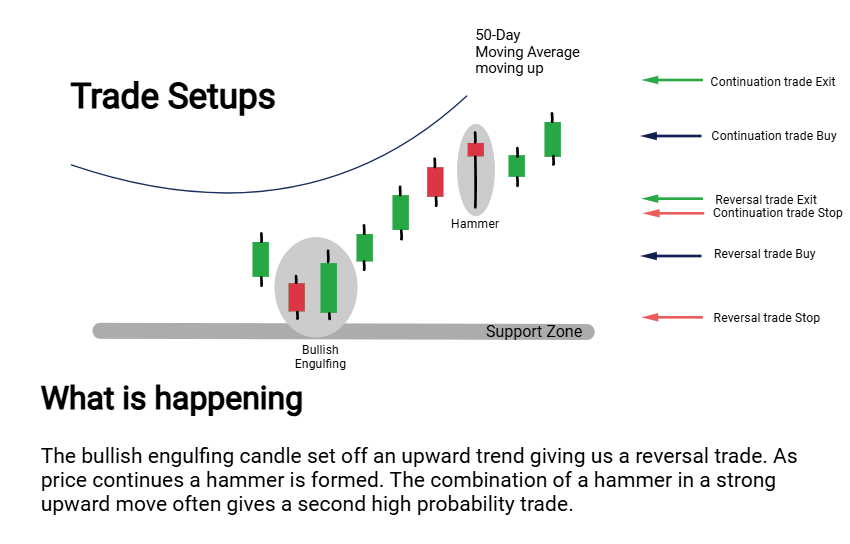
4. Bullish Engulfing
- Formation: Small bearish candle followed by a larger bullish candle that engulfs it.
- Meaning: Strong buying pressure, signaling a bullish reversal.
- How to Trade:
- Spot at support after a downtrend.
- Buy above the engulfing candle’s high, stop below its low.
- Example: A Bullish Engulfing at a support zone suggests an uptrend.
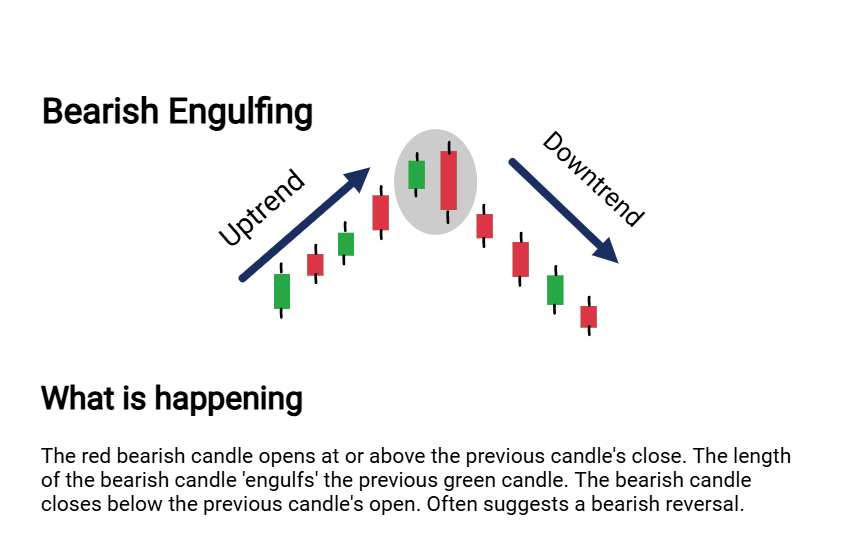
5. Bearish Engulfing
- Formation: Small bullish candle followed by a larger bearish candle that engulfs it.
- Meaning: Strong selling pressure, indicating a bearish reversal.
- How to Trade:
- Identify at resistance after an uptrend.
- Sell below the engulfing candle’s low, stop above its high.
- Example: A Bearish Engulfing at a moving average signals a pullback.
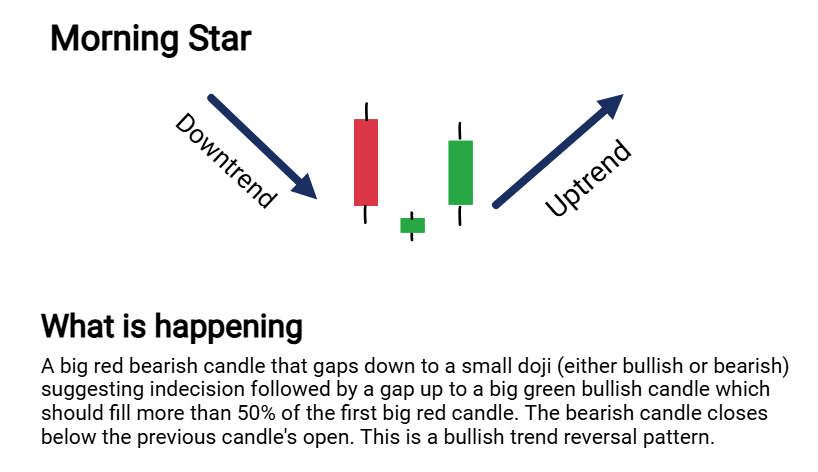
6. Morning Star
- Formation: Three candles: bearish candle, small-bodied candle (e.g., Doji), bullish candle.
- Meaning: Bullish reversal, transitioning from selling to buying.
- How to Trade:
- Confirm at support with volume or indicator confirmation.
- Buy above the third candle’s high, stop below the pattern’s low.
- Example: A Morning Star at a key level predicts a trend shift.
The Psychology Behind Candlestick Patterns
Candlesticks work because they capture human emotions—greed, fear, hesitation—that drive markets. For example:
- Doji: Reflects a tug-of-war between buyers and sellers, signaling a pause.
- Hammer: Shows buyers stepping in to defend a price level, rejecting further declines.
- Engulfing Patterns: Indicate a sudden shift in sentiment, with one side overwhelming the other.
Understanding this psychology lets you anticipate market moves, making candlesticks a powerful complement to other charting methods like point and figure or Heikin Ashi.
This is merely an overview of the main types of candlesticks. There are many variations of each of these candlesticks
Advanced Candlestick Strategies
To maximize candlestick effectiveness, combine them with other technical tools. These evergreen strategies work across markets and charting platforms:
1. Candlesticks at Support and Resistance
- How: Trade patterns like Hammer or Bullish Engulfing at key levels (e.g., previous highs/lows, trendlines).
- Example: A Doji at a support zone, followed by a bullish candle, signals a buy opportunity.
- Tip: Draw levels manually on any charting platform to spot confluences.
2. Candlesticks with Trend Indicators
- How: Use moving averages (e.g., 50-period, 200-period) to confirm trend direction, then trade patterns like Morning Star near the MA.
- Example: A Hammer touching a rising 50-MA suggests trend continuation.
- Tip: Adjust MA periods to suit your timeframe (e.g., shorter for scalping).
3. Candlesticks with Volume
- How: Confirm patterns with high volume for stronger signals. A Bullish Engulfing with rising volume indicates conviction.
- Example: A Bearish Engulfing at resistance with a volume spike predicts a sharp drop.
- Tip: Check volume bars on your chart to validate setups.
Practical Trade Examples
These examples illustrate candlestick charting in action, applicable to any market or timeframe:
- Reversal Trade:
- Setup: A Bullish Engulfing formed at a support level on a 4H chart, confirmed by a rising 50-MA.
- Action: Bought above the engulfing candle’s high, stop below its low.
- Outcome: The price rallied significantly, achieving a 3:1 reward-to-risk ratio.
- Lesson: Engulfing patterns at support with trend confirmation are high-probability.
- Continuation Trade:
- Setup: A Hammer appeared in an uptrend, touching a trendline with high volume.
- Action: Bought above the Hammer’s high, stop below its low.
- Outcome: The uptrend continued, yielding a profitable trade.
- Lesson: Hammers in trending markets signal strong continuations.
Common Candlestick Mistakes to Avoid
- Trading in Isolation: Always confirm patterns with levels or indicators to avoid false signals.
- Misreading Context: A Doji in a range-bound market is less significant than at a trend’s end.
- Overcomplicating Charts: Focus on 1–2 patterns per setup to stay clear-headed.
- Ignoring Risk Management: Set stop-losses and size positions to protect capital.
- Relying on Poor Charts: Ensure your platform offers clear candlestick visuals for accurate analysis.
Tools to Enhance Candlestick Charting
While candlestick principles apply universally, advanced charting platforms can streamline your analysis. For example, TradingView offers a unique candlestick pattern recognition tool that automatically highlights Dojis, Hammers, and more, saving time for busy traders. Explore TradingView to enhance your charting (ChartTheTrade.com may earn commissions from links at no cost to you). Most platforms, including free broker charts, support candlestick analysis, so choose one that fits your needs.
How to Practice Candlestick Charting
- Learn Patterns: Study the six patterns above, using a cheat sheet for reference.
- Analyze Historical Charts: Review past price action to identify patterns.
- Practice in a Demo Account: Test setups without risking capital.
- Join Charting Communities: Share ideas with other traders to refine your skills.
- Daily Chart Review: Spend 10–15 minutes spotting patterns in real time.
Resource: Download our free Candlestick Cheat Sheet to master patterns quickly (link to form).
Your Next Steps
Candlestick charting is a foundational skill that complements other charting methods like Renko or point and figure. To master it:
- Memorize the six patterns above.
- Practice one pattern (e.g., Hammer) on historical charts.
- Test a strategy (e.g., candlesticks at support) in a demo account.
- Download our Candlestick Cheat Sheet for quick reference.
- Explore ChartTheTrade.com’s guides on Renko, Heikin Ashi, and more to broaden your charting expertise.
Ready to chart smarter? Get our free Candlestick Cheat Sheet or browse our Charting Guides for advanced techniques across all charting styles.
ChartTheTrade.com is your guide to mastering charting, from candlesticks to renko. Learn timeless strategies to trade better.